
Originally published 18-Mar-2020
Here is the March-18 update to the Covid-19 table.
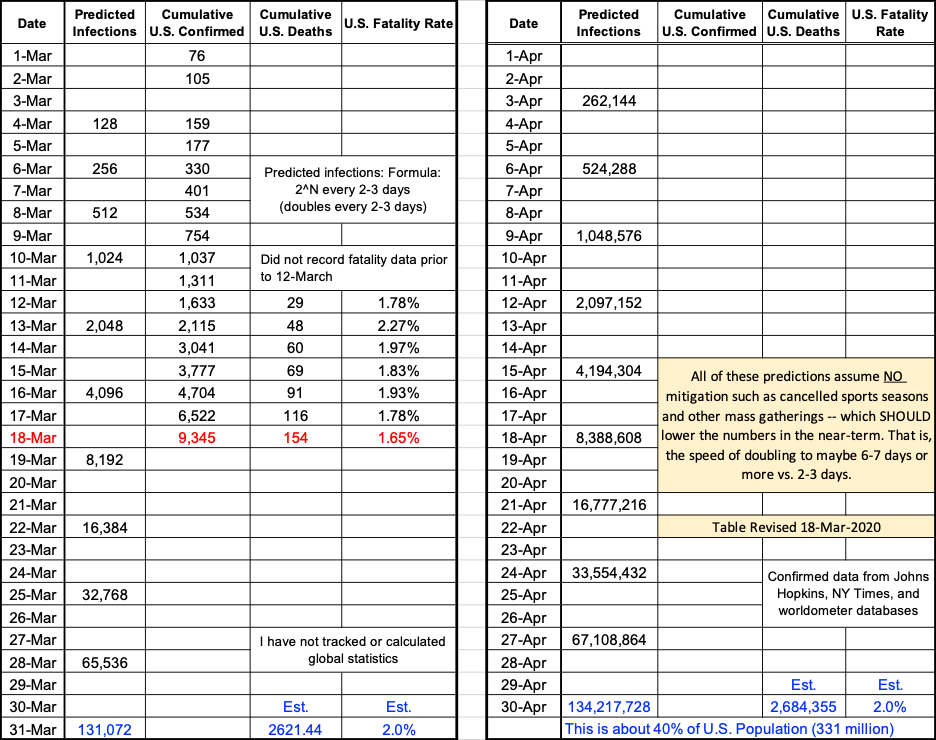
The numbers continue to grow. They match predicted values (doubling about every 3-4 days or so) until 16-March, after which they appear to be growing at a more rapid rate. Today (18-March) they exceed the predicted value. By tomorrow they will be much greater than predicted. While 8,192 cases are predicted on 19-March it wouldn’t be surprising to see numbers well in excess of 10,000. The reason for this, as mentioned previously, will be due to an increase in testing with a corresponding increase in the number of confirmed cases. This is both bad news and good news. The bad news is that the number of confirmed cases is larger than predicted. The good news is twofold: 1) we are getting a more accurate number of cases, helping to geographically focus medical resources, and 2) a larger number wiolo yield a lower estimated fatality rate, assuming the number of deaths continues to grow at the current rate.
At some point we could expect to see a more stable count of confirmed cases – giving us, one might think, a new “starting point” for the doubling equation and doubling rate. Unfortunately this undermines the ability to accurately predict using a simple formula like 2^N since we will have to include the effects of mitigation measures. Significantly more sophisticated modeling will be required at that point. Of course failed mitigation would allow the doubling equation to work well – predicting millions of deaths before summer.
So… hopefully mitigation measures such as cancelled sports seasons, closed schools, closed theatres, quarantines, working from home, etc. will help to significantly slow the rate of growth – which will lower the demand on healthcare resource which in turn should reduce the number of deaths in the near-term. Nevertheless, over time the doubling rate will continue, just at a much lower rate. Current estimates and historical (1918) statistics still suggest over 100 million U.S. cases. The good news is that a vaccine in a year or so should help reduce the fatality rate. Instead of over ~1.5 million deaths we may then see less than a million. These are semi-wild guesses on my part as I do not (yet) have access to sophisticated modeling tools.
You can see how even a small number of factors might combine to yield seriously muddled predictions. At the moment we might expect 3-4 day 2^N “explosive” growth to continue in the U.S. (and Europe) for a while yet, modified as time goes on by increased testing and mitigation. This is very thin ice – nonlinearities abound, which can quickly and ruthlessly shred any predictions, good or bad.
Since my first email of March 8 (all of 10 days ago!) there has been a considerable increase in the level of responsible, accurate media/online information regarding Covid-19 symptoms, statistics, and mitigation measures. The original intent of this email thread was to provide some valid information, but I’m pretty sure we are now all much more up-to-speed on these factors.
Going forward I plan to focus more on information that may be lost in the media “noise.” In particular I am thinking that many of us would like to know the answers to a few questions (beyond health-related), including:
1) When will the current “crisis mode” pass?
2) What will the next few weeks / months bring in terms of “way of life” and government measures?
3) What will be the “unintended consequences” of mitigation measures?
4) When will our savings stop taking hits, and how big will the hits be?
5) When will we begin to recoup our losses?
6) When, longer-term, will things return to “normal” and what will “normal” be?
7) What are anticipated/likely long-term sociological/cultural/economic repercussions?
You might notice that these questions tend to be of the “when will…” variety. Immediate answers involve prediction based on limited current information – always treacherous footing for prediction. We might be able to conjure some sense of the near future based on careful analysis of data, cause/effect and critically, history. And while history may provide some insight into major events and governmental/sociological actions/reactions, our current times are different in a number of significant ways, including planet-wide instantaneous inter-personal and data communication and accelerating technological growth across the board. For example, trying to undertake an acceptable comparison of societal and medical implications of Covid-19 characteristics to Spanish flu characteristics is not for the faint of heart. There are a lot of dimensions, any one of which could significantly modify any detailed comparisons and consequent predictions.
Undaunted, I will see if anything helpful can be uncovered regarding some of the issues identified in the above questions and will, of course, continue to update the table.
“Dr. Pat”
P.S. As always feel free to forward this blog to others who you think may be interested.
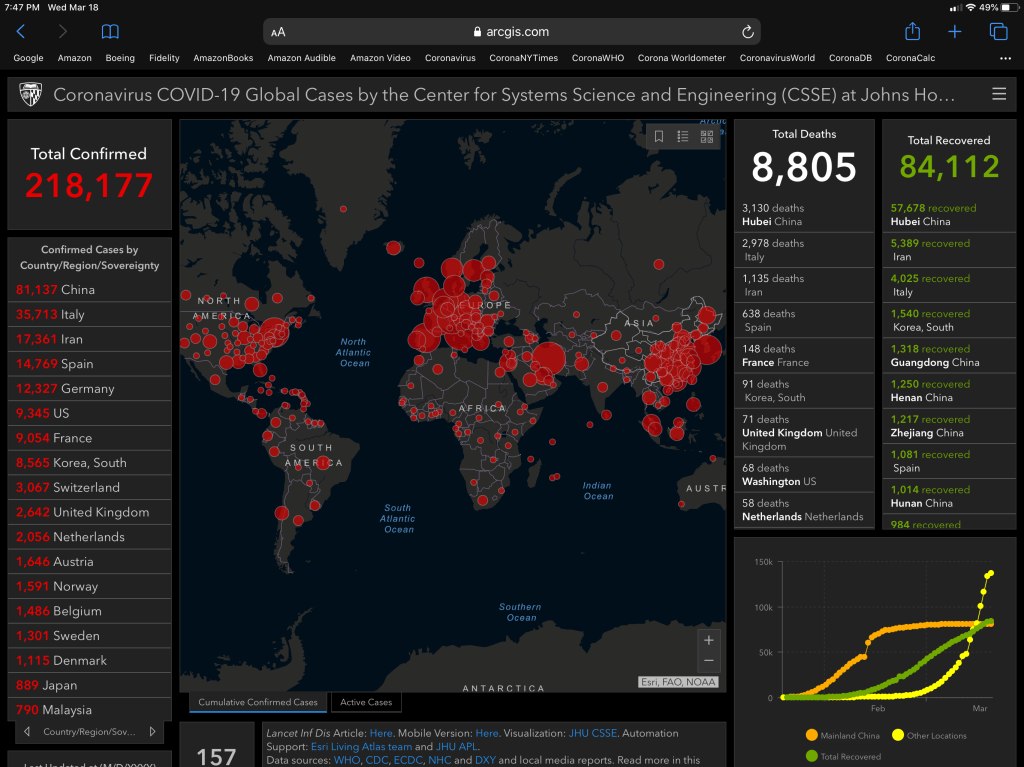
Johns Hopkins data reported in the evening, 18-March-2020. Note the yellow curve (cases outside China).

Comment test
LikeLike