“Prediction is very difficult, especially if it’s about the future” — Niels Bohr, Nobel Laureate in Physics, 1885-1962
First the data (evening April 5):

The number of confirmed U.S. cases currently exceeds 337,000. Trends based on 3rd order trend line continue on track to reach ~650,000 by Easter, and ~2,500,000 (I know — hard to believe) by the end of April. Current estimated fatality rate is about 2.86%, corresponding to over 68,000 deaths by April 30. The fatality rate has been steadily increasing over the past week. This is unexpected since the thought was that additional testing would reduce the denominator. The reason remains unclear at this time. Need more data.
Now — The Future
The following predictions are for those of you with a somewhat less mystical view than that presented in our previous pseudo-Nostradamian post. Keep in mind that the trends and predictions enumerated below are based on the very limited sets of data acquired to date. As the disclaimer says, “Your results may vary.”
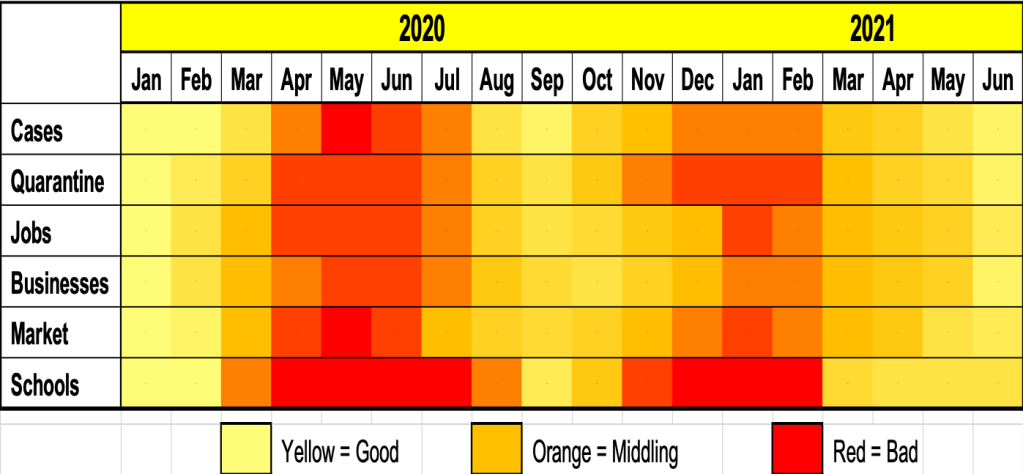
This image looks like one of those pictures you’re supposed to stare at and see Abe Lincoln or the Mona Lisa or a cat. It’s sort of like that – at least the staring part. There a number of things to notice. The columns cover the next year or so month by month. The rows illustrate measures for different categories; where yellow is “good,” orange is “okay,” and red is “bad.” These colors are intended to reflect trends and predictions based on the limited data acquired to date. Together the rows and columns attempt to paint a picture of how the future may unfold.
At the highest level you see April-June and December-February “red zones.” This cyclic nature is relatively common for influenza and was very evident during the 1918 Spanish flu. These red zones are the strongest influence on the following prognostications.
Also keep in mind that the following observations and hazy predictions are based on a very limited set of available data. That last part there is the fine print providing a way out in the unlikely case that any of the predictions come up short.
— To start: We’re at a big bump of red right now (April 2020).
— The red will continue beyond May/June 2020, probably into summer 2020.
— Things will get a little better then although the economy will continue to drag.
— The economy will not instantaneously “turn back on” despite wishing and thinking to the contrary.
— Schools will open in September 2020. Things will be getting better overall.
— In Fall 2020 Covid will reappear possibly with the vengeance of the 1918 flu.
— Fall 2020 won’t be as bright red as it is now: Hopefully we will be better prepared.
— Fall and Winter 2020 may be worse if the government continues to bungle its response, especially testing and logistics.
— Whether the government comes through or not Christmas 2020 will find us in the doldrums. Similar to but not as bad as this Spring and Summer 2020.
— Vaccine production will begin somewhere between Valentine’s Day and Easter 2021.
— This will be followed by months of mass vaccination and general sighs of relief.
— By Spring 2021 the country will be stirring back to life.
— The rest of the world will be struggling to do the same.
— Schools may re-start before Summer 2021.
— By Summer 2021 we should be ramping up to 2017/18 markets, economy, and jobs levels — depending strongly on 2020 elections and global recovery.
— The government will be working to clean up the mess left in the wake of the previous administration.
Beyond June 2020 we are heading more deeply into guess-land. Try these on for size:
— By Fall 2021 we should be well on the road to recovery.
— Christmas 2021 will be Merry except for the families of the (~1 million??) American dead.
— January 2022 will see publishers pumping out countless pandemic histories and tell-alls.
— On February 1, 2022 the government will formalize a permanent Office of Pandemic Preparation.
— Movies will follow in Summer 2022.
‘Nuf said.
