A concise non-sensationalized summary of U.S. Covid-19 pandemic situation, projections, and background information.
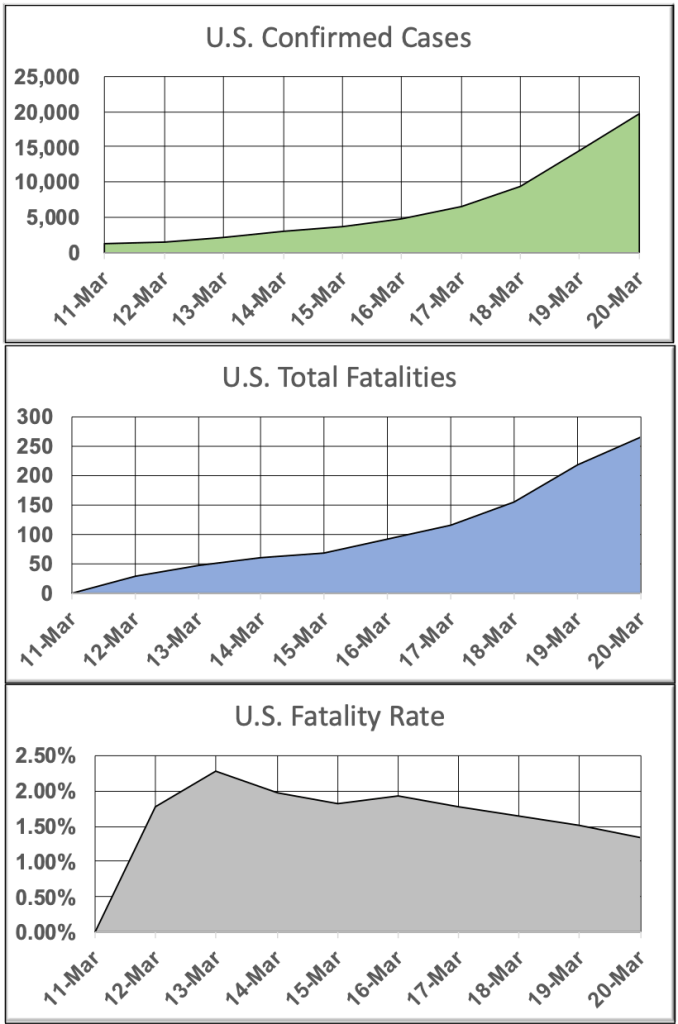
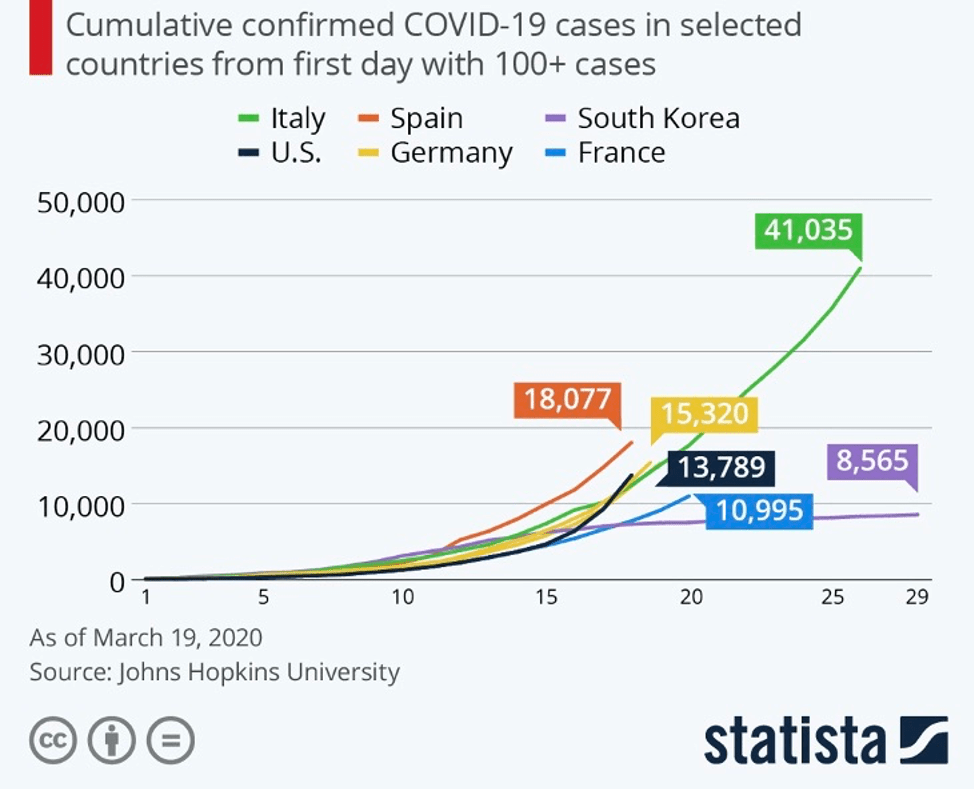
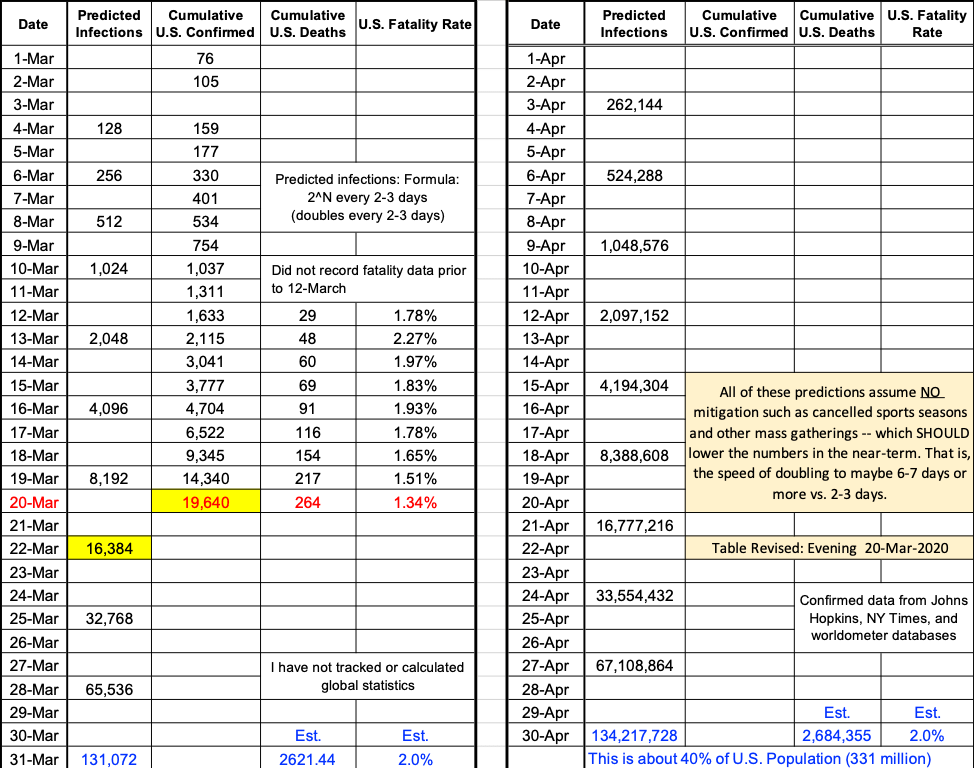
March 20, 2020. In order to provide a simplified view of pandemic trends we are introducing a few new plots (in addition to the usual table of statistics at the bottom of this post). The first three plots show that, unfortunately, we are still very early in the progression of the pandemic. The trends going forward are terrifying. In the fourth plot, comparing number of U.S. cases to number of current cases for Italy, we can see that the potential for explosive growth is very real. Indeed, the data portends trends described in prior blog posts that show U.S. cases growing exponentially (2^N), doubling every few days (hopefully more slowly depending on effectiveness of containment/mitigation/suppression measures). A review of results and projections from multiple models by recognized sources indicate U.S. confirmed cases growing into tens of millions or more with a commensurate number of deaths. For example, 100 million cases x 1% fatality rate = 1 million deaths (possibly over a few months but more probably over a period of a few years). Yeah. Time for a shot bottle of schnapps.